From 0-60 in 10 million seconds! – Part 1
17 February 2012 | By
OK, so I’ll try to give a flavour of how the data that we collect gets turned into a published result. As the title indicates, it takes a while! The post got very long, so I have split it in two parts. The first will talk about reconstructing data, and the second will explain the analysis stage.
I just finished working on two papers, which have now been published, one in the Journal of Instrumentation, and the other in Physics Letters B. You can see them here and here. By the way, some of the posts I am linking to are from two to three years ago, so the wording may be dated, but the explanations are still correct.
When an experiment first turns on this process is longer than when it has been running for a while, since it takes time to understand how the detector is behaving. It also depends on the complexity of the analysis one is doing. To be familiar with some of the terms I mention below, you should take the online tour of the ATLAS experiment.
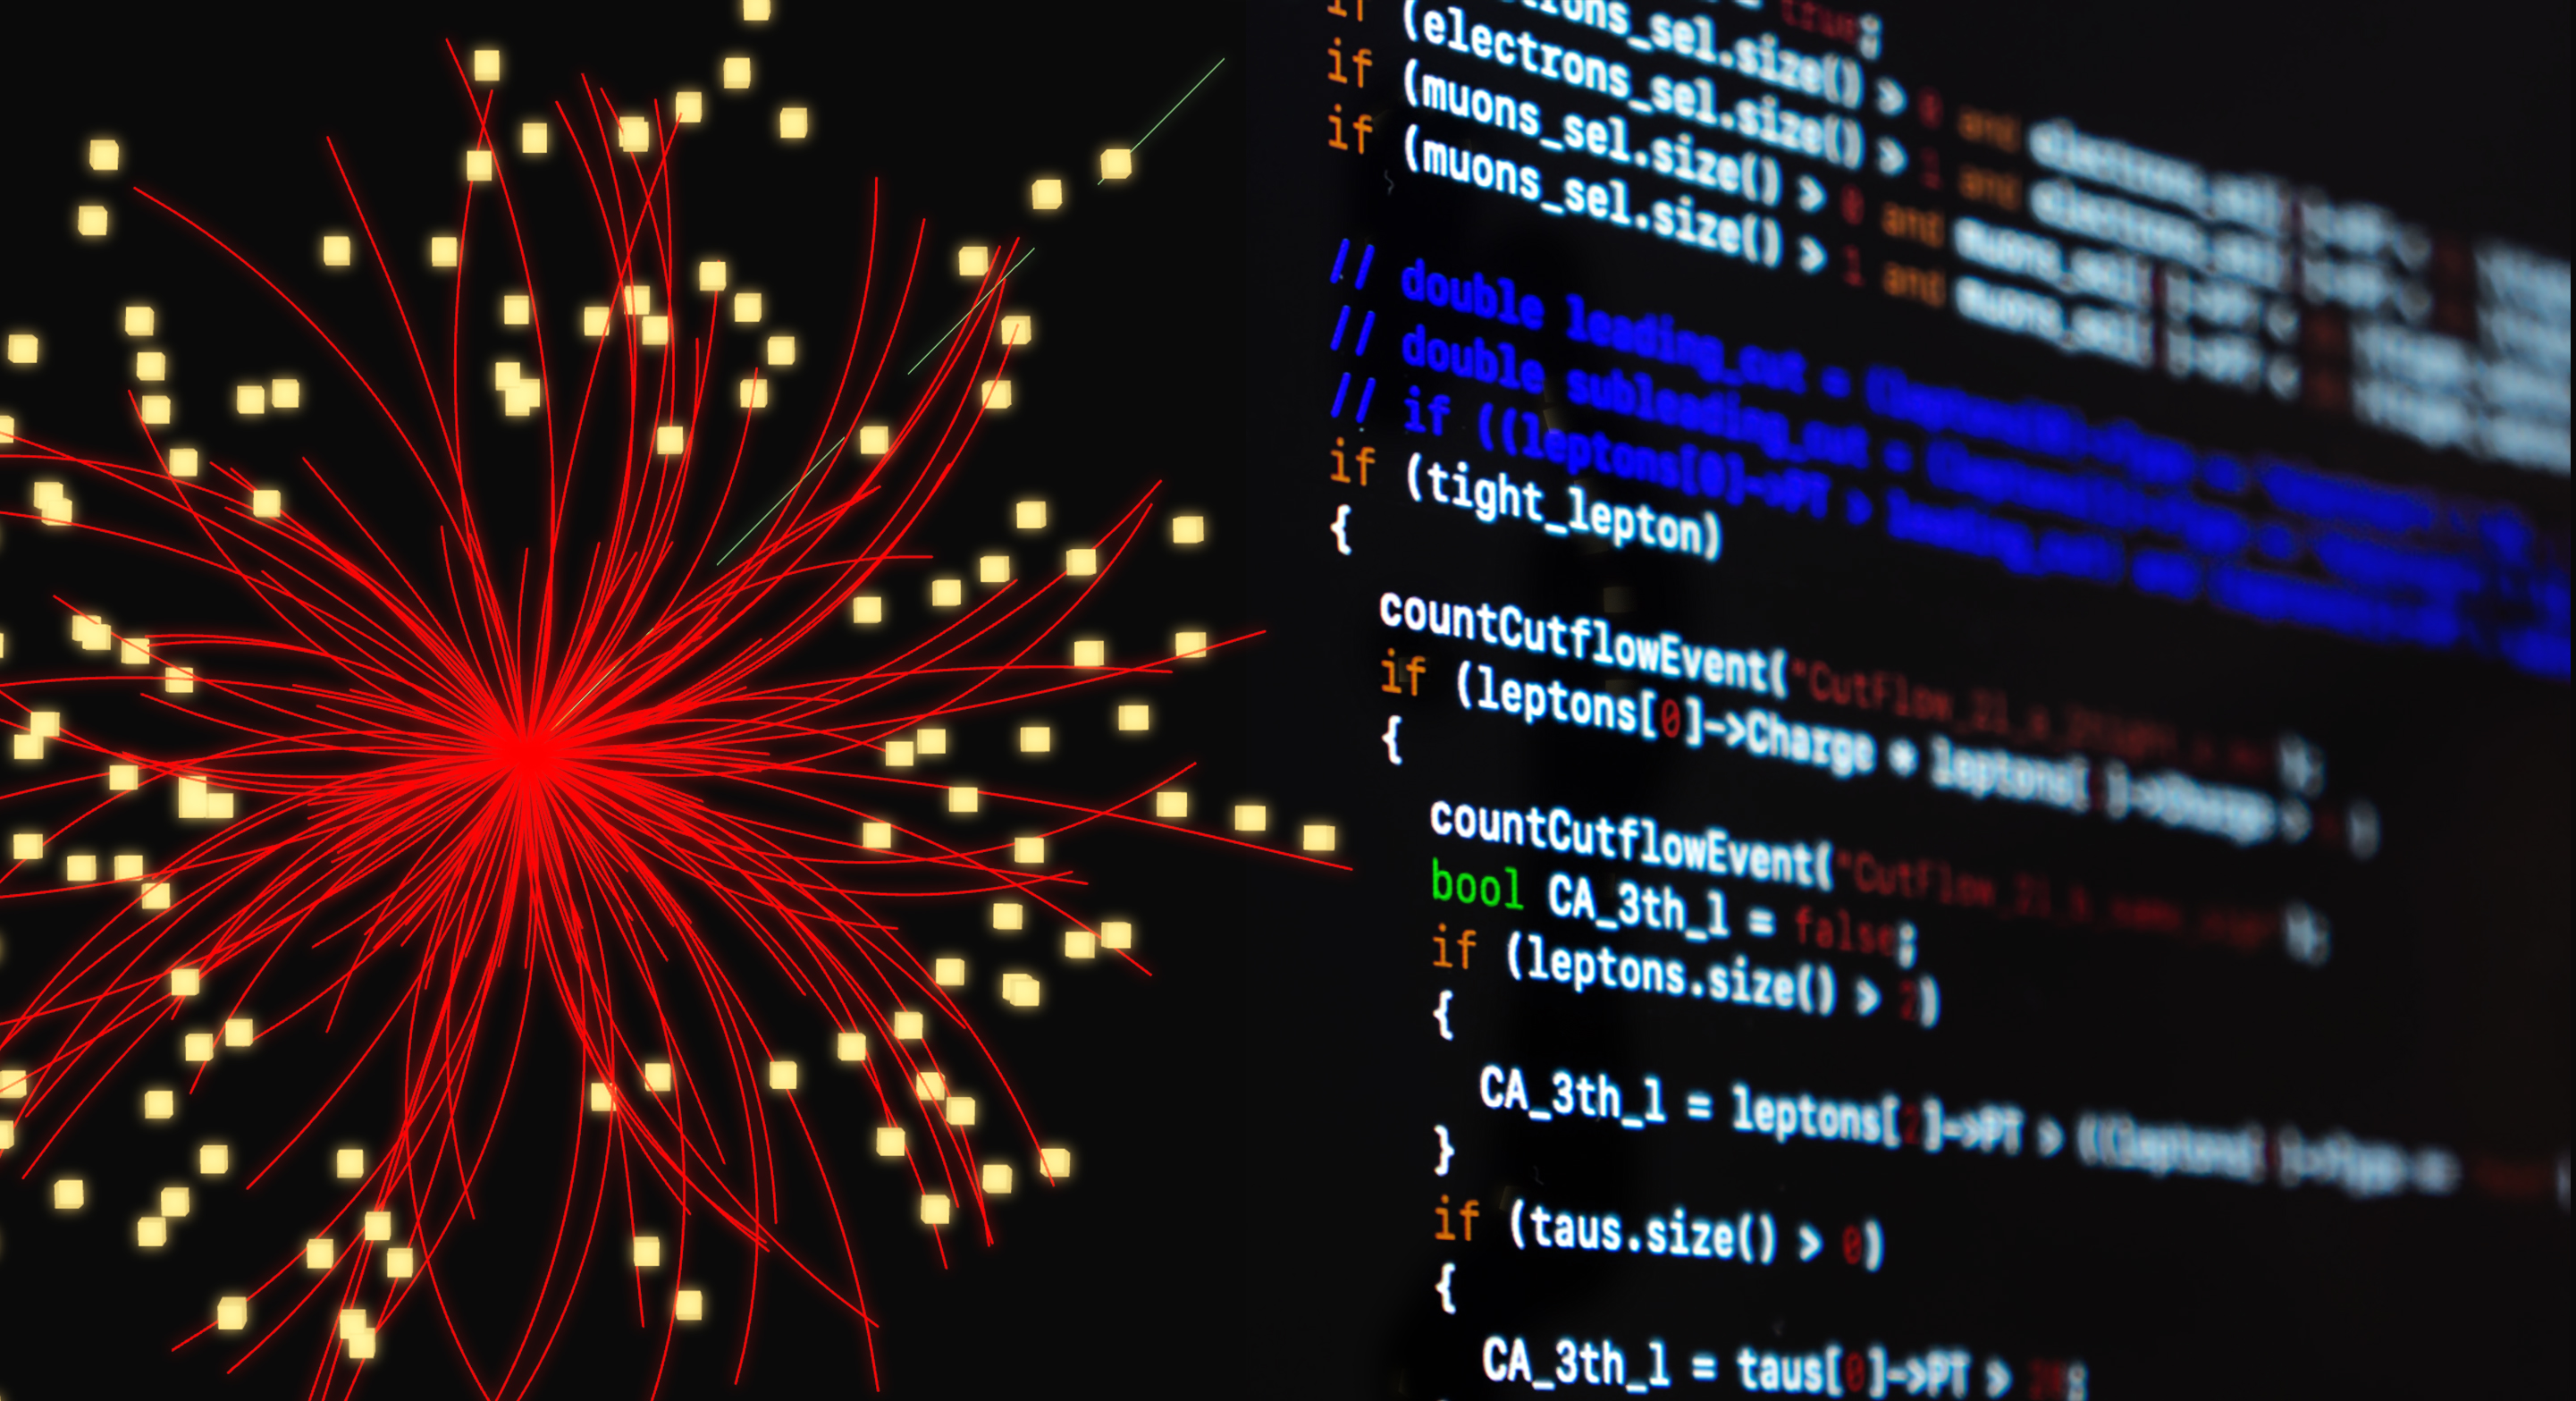
For each event, data recorded by ATLAS is basically a stream of bytes indicating whether a particular sensor was hit in the tracking detectors or the amount of energy deposited in the calorimeter or the location of a hit in the muon system, etc. Each event is then processed through the reconstruction software. This figure gives you an idea of how different particle species leave a signal in ATLAS.
For instance, the part of the software that deals with the tracking detectors will find hits that could be due to a charged particle like a pion or a muon or an electron; in a typical event there may be 100 or more such particles, mostly pions. By looking at the curvature of the trajectory of a particle as it bends in the magnetic field, we determine its momentum (see Seth Zenz’s post on tracking). Similarly, the software dealing with the calorimeter will look at the energy deposits and try to identify clusters that could be due to a single electron or to a spray of particles (referred to as a “jet”), and so on. I believe the ATLAS reconstruction software runs to more than 1 million lines of code! It is very modular, with different parts written by different physicists (graduate students, post-docs, more senior people, etc.).
However, before the reconstruction software can do its magic, a lot of other things need to be done. All the sub-detectors have to be calibrated. What this means is that we need to know how to convert, say, the size of the electronic signal left behind in the calorimeter into energy units such as MeV (million electron volts – the mass of the electron is 0.5 MeV). This work is done using data that we are collecting now (we also rely on old data from test beams, simulation, and cosmic rays.
Similarly, we have to know the location of the individual elements of the tracking detectors as precisely as possible. For instance, by looking at the path of an individual track we can figure out precisely where detector elements are relative to one another; this step is known as alignment. Remember, the Pixel detector can measure distances of the order of 1/10th the thickness of human hair, so knowing its position is critical.
Periodically, we re-reconstruct the data to take advantage of improved in algorithms, calibration and/or alignment and also to have all of the collected data processed with the same version of the software. In the next post, I will take you through the analysis stage.
About the author(s)
Vivek Jain
Vivek Jain is a Scientist at Indiana University, Bloomington. His current interests range from understanding various aspects of tracking to R-parity violating Supersymmetry. More information about his interests can be found at http://www.indiana.edu/~iubphys/faculty/jain2.shtml