Waiting for physics: Splashing beams
10 May 2018 | By

Each year, around mid-spring, the giant LHC accelerator wakes up from its winter maintenance and gets ready for a new feverish period of data taking. But before smashing protons once again, some tests have to be done, to check that everything is in order and that the machine can accelerate and collide particles properly, as it did before the shutdown.
Among the many tests run by the LHC experts, two of them are major milestones for the experiments: the so-called “beam splash” and “stable beams” tests. These tests are the first observations of particle collisions after the restart, and are used by the experiments to check that all instruments, workflows, machines and pieces of software run as expected.
The dates of all the tests are not precisely scheduled in advance: the broad period of the LHC restart is planned, but the exact date and time of a given test really depends on the outcome of many other tests performed in the preparatory phases preceding it. When the LHC experts are confident that everything is in order, they let the experiment operators know about the imminent start. And that moment can be any time: during the weekend, or in the middle of the night. When that times approaches, all the experiments are in an "alarm" state, ready to take any bit of data coming out from the collisions in the LHC. WE don't want to miss any of the precious data coming out from it!
When “beam splash” and “stable beams” tests are announced, all the people at ATLAS who are involved in data-taking activities – such as data acquisition, detector control, data preparation and data visualization – are “on duty”.
I am currently part of the data visualization group. We develop the visualization software that converts data, measurements and numbers into useful – and good looking – images called “event displays”. In particular, I am the lead developer and the maintainer of VP1, the 3D event display of the ATLAS experiment, which is the software used to produce the image accompanying this story.
The image is not a simulation: it is a visual render of real data, a representation of the measurements taken by some of the detectors which compose the huge and complex ATLAS experiment.
We created our first event display from 2018 data on 6 April, for ATLAS’ successful “beam splash” test. During “beam splashes”, the accelerated beams are steered toward a collimator upstream of the detector, making them interact and creating a huge “splash” of particles. The ATLAS experiment worked very well, as shown in the image, where we can observe the visualisation of the energy deposited in the central detectors by the many particles produced in the “splash”. The image is not a simulation: it is a visual render of real data, a representation of the measurements taken by some of the detectors which compose the huge and complex ATLAS experiment.
During a “beam splash”, the protons accelerated by the LHC hit a fixed target placed on the beamline before the detector, and the particles created in the interaction move on, along the beamline and outwards. They pass through layers of particle detectors, interact with them and leave some amount of their energy. This is visualised in the picture as: red/white stripes in the inner layers (here showing the interaction with the TRT, which is part of the Inner Tracking detectors); green boxes in the LAr electromagnetic calorimeter, which is especially built to interact with electrons and photons; and as yellow boxes in the TileCal hadronic calorimeter, conceived to detect hadrons (particles made of quarks: protons, pions, and so forth). From the image, you can notice that there seems to be more activity in the part of the detector closer to you, on the right; this is a peculiarity of the “beam splashes”: from the fixed target, the particles created in the interaction move like a big, advancing, and enlarging cone, hitting more and more layers of ATLAS as it moves from the left to right of the image. By looking at images like the one above, we can check that all the sub-detectors are working well, and can verify the correct data taking. This is an important step in testing the whole data workflow, in anticipation of “stable beams”.
To hear about our work during the “stable beams” run, read my next post!
About the author(s)
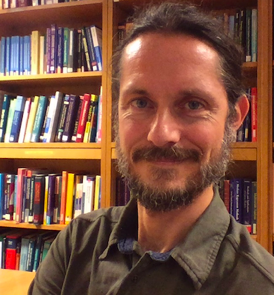
Riccardo Maria Bianchi
Riccardo Maria Bianchi is a particle physicist from the University of Pittsburgh, based at CERN where he works on the ATLAS Experiment. Over the past 12 years, he has worked on searches for supersymmetry and extra dimensions, muon detectors, data acquisition, parallel computing, computational methods, and interactive data visualization. He is the coordinator of the HSF “Visualization” working group, and of the ATLAS Virtual Reality group, and he recently collaborated on the textbook “Applied Computational Physics” (Oxford, 2017). He likes explaining science in simple words, collaborating with artists on works between art and science, and helping in the organization of public science exhibitions (Sperimentando 2018, Cultural Collisions). Follow Riccardo on Twitter or visit his website.