Waiting for physics: Stable beams!
11 May 2018 | By

Following the first “beam splash” tests in early-April, the ATLAS experiment awaited the next milestone on the road to data-taking: "stable beams". This is when the LHC proton beams are aligned, squeezed, focused and finally steered to collide head-to-head. It is an important test, as it allows us to verify that the collision mechanism is ready to take data that are good for physics studies.
But when would we see them? Before trying to collide the beams, the LHC experts want to be sure that every single parameter of the beam is correct. As such, over a period of few days, many preparatory tests are run, the actual first “stable beams” run waiting for the green flags from each of them. Finally, on the evening of 16 April, I got an e-mail from one of the Data Preparation coordinators announcing stable beam collisions for the following morning.
Ready. Steady. Go!
The Data Prep team is responsible for the correct reconstruction and packaging of the experimental data selected by the data acquisition system, and has tools to quickly look inside the incoming data. Data Prep experts are able to quickly select the data coming from a given collision range; moreover, they can pick events which show interesting features: for example, a muon candidate, or two high-energy jets, or whatever else that can show that everything works fine and the collisions between the protons succeeded. As soon as they spot an interesting event, they prepare a data file containing all the details of that event and they pass it to the Visualization team.
As “stable beams” collisions had been announced “during the morning”, I wanted to arrive at work early enough to prepare everything before the data started flowing in. When I’m involved in data-taking activity, I am usually in the control room of the experiment, close to the iconic CERN Globe of Innovation. This time, instead, I wanted to be in my office, as the visualization software I wanted to use (which I developed for ATLAS with a small team of people), needs a specific setup and a quite powerful computer to be run smoothly. Thus, working in the control room on my laptop was not an option.
Most of the pieces of software used in the ATLAS experiment are custom made, because the needs and requirements of an experiment like ATLAS are so specific no commercial software will do. The ATLAS experiment itself is a giant prototype; consequently, the software running it and taking care of its data has to be developed from scratch.
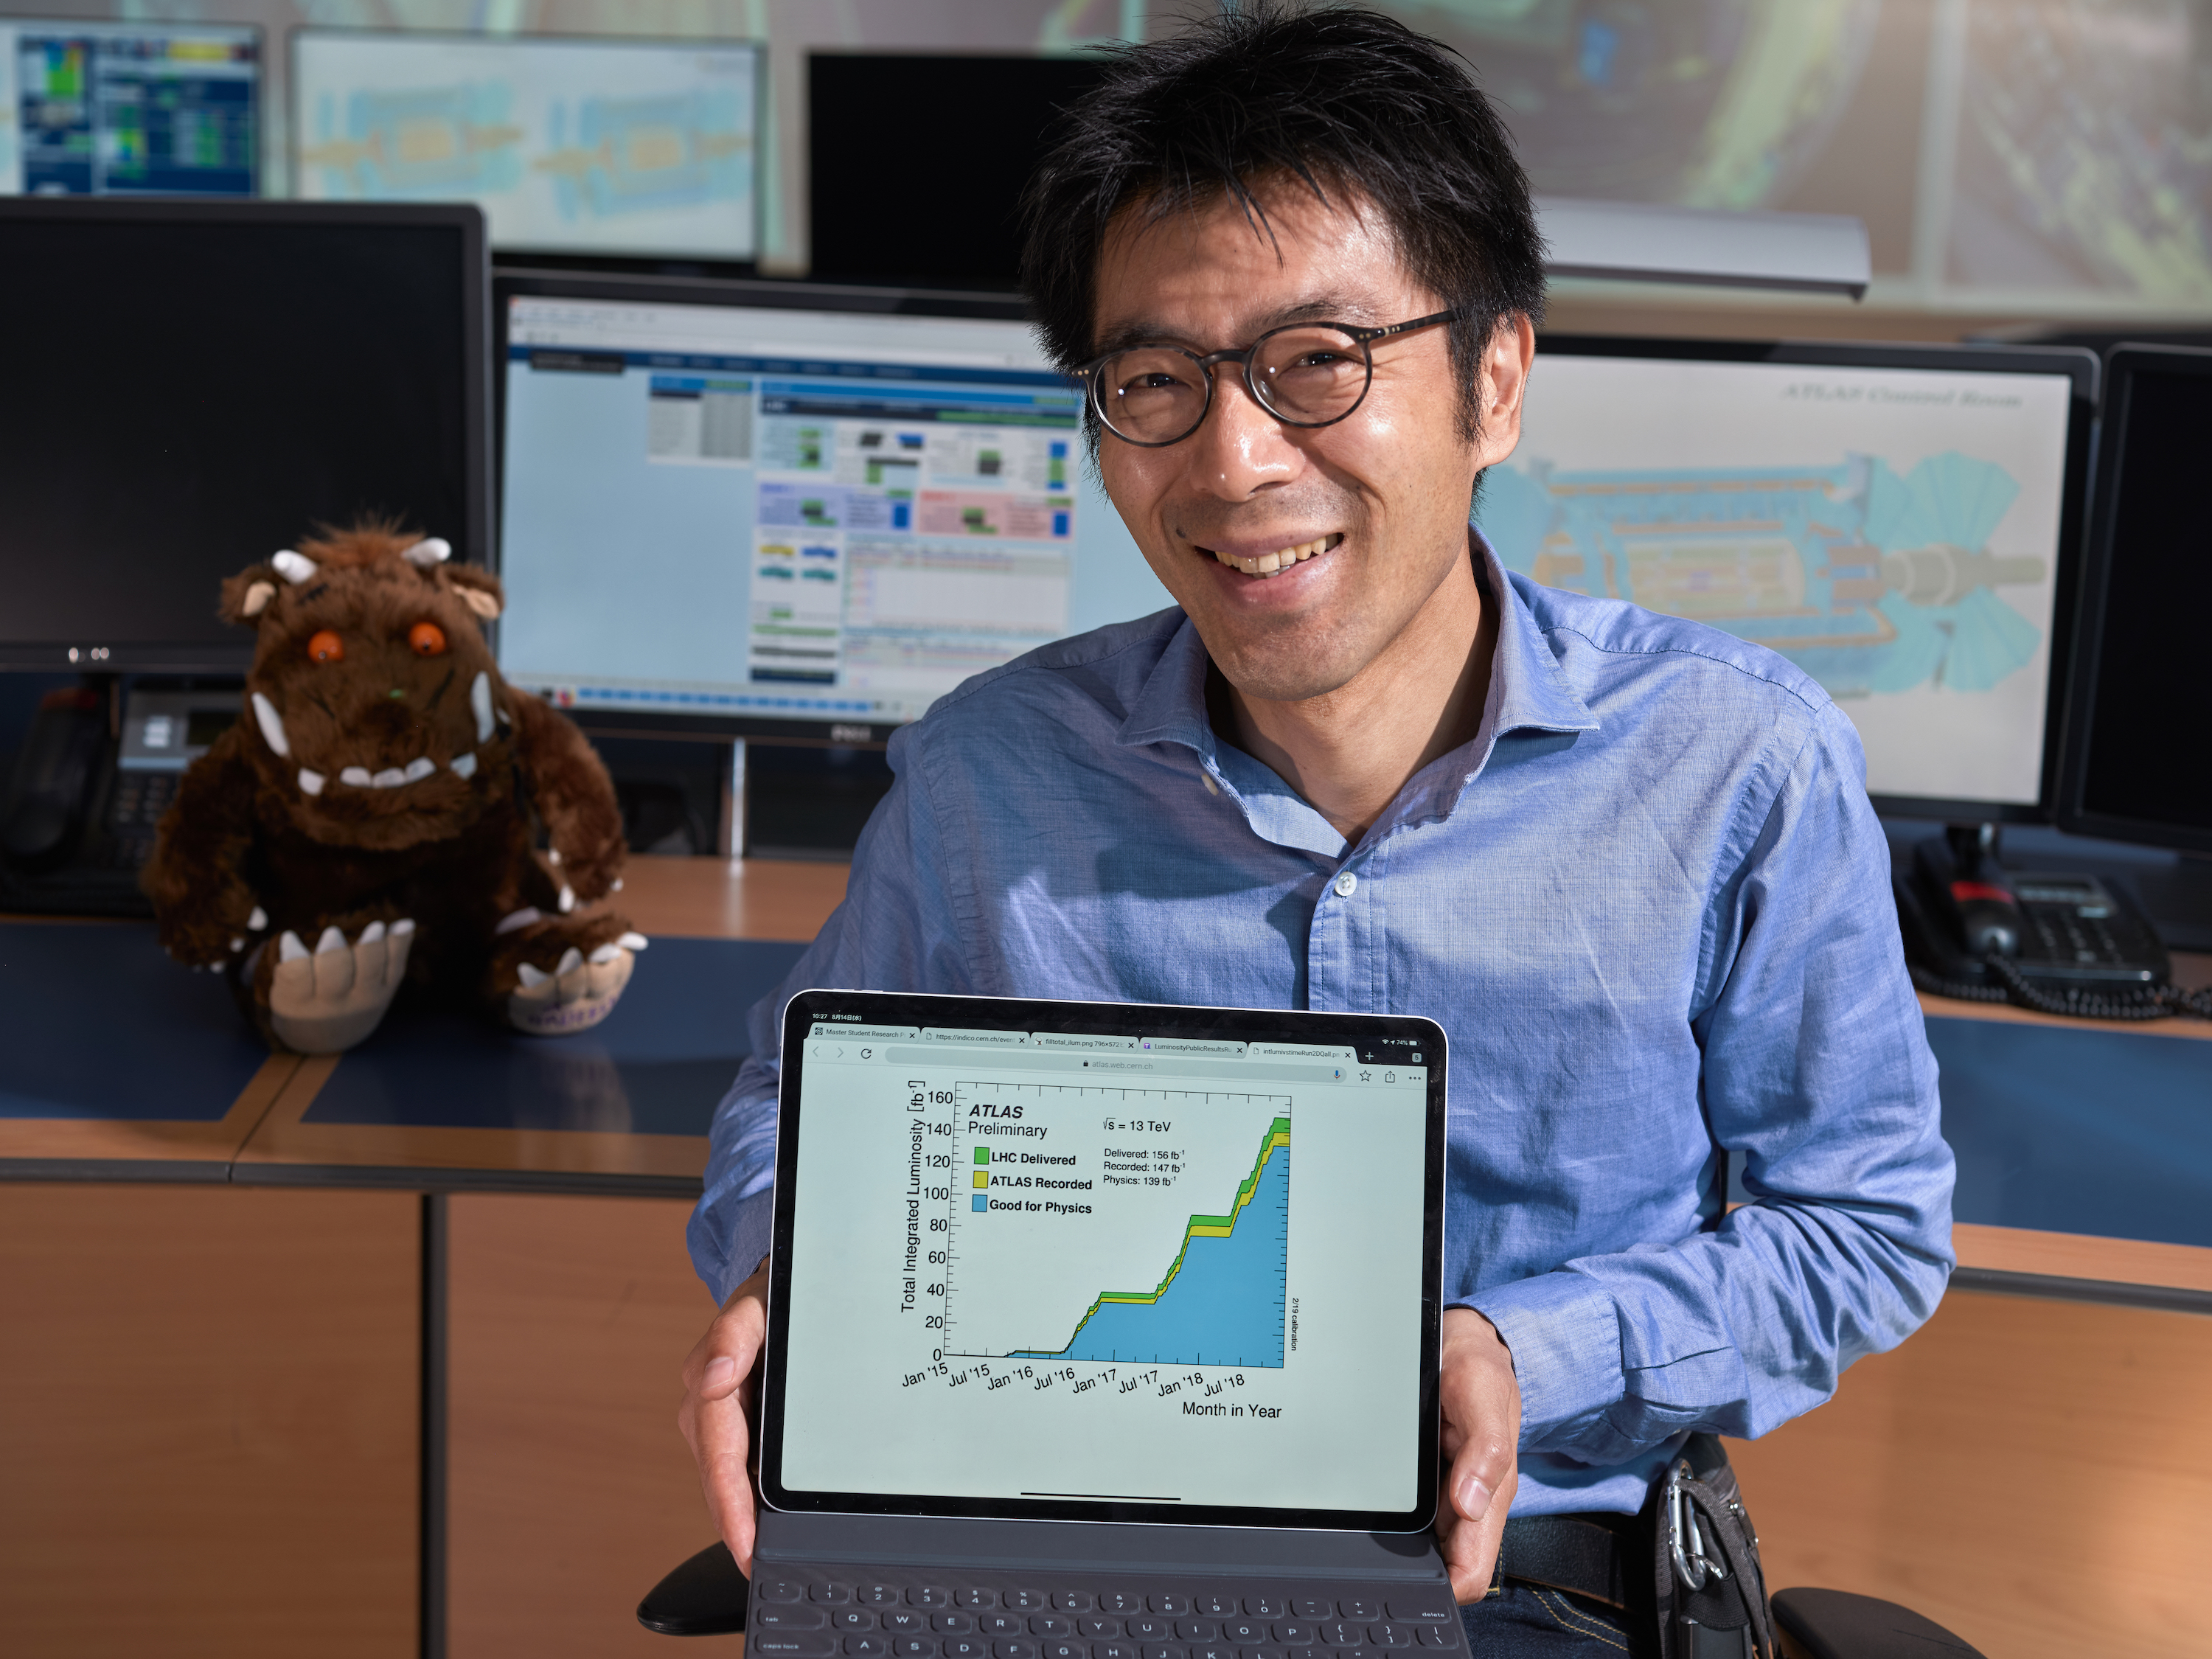
I took the tram from downtown Geneva early that morning, passing by the main cafeteria for coffee and a croissant, before arriving at my office on the first floor of Building 40. It was 7:30 a.m. so the building was unusually silent. I switched on my machines and started setting up all the needed software environments. While that worked, I exchanged e-mails with the control room shifters on a second screen, discussing the details of the morning work plan of the accelerator. All the while I kept my eye on the LHC live screen, checking the status of the beams in the accelerator and not to miss the collision moment. This live screen – which is public and I encourage you to look at – allows us to follow the filling, acceleration, squeezing and focusing of the beams, as well as many other parameters of the LHC.
LHC experts ran additional tests all morning. Around 12:00 p.m., we finally had two proton beams circulating in the LHC at the right energy. The first “stable beams” collisions of the year were approaching…

Creating an event display
In order to be sure to have everything ready when needed, I had started visualizing data taken during the earlier test runs an hour before. They were not as interesting as the new ones would be, but they were useful to test the tools and to prepare some configuration files, ready to be used to quickly setup our visualization software when the interesting data would come.
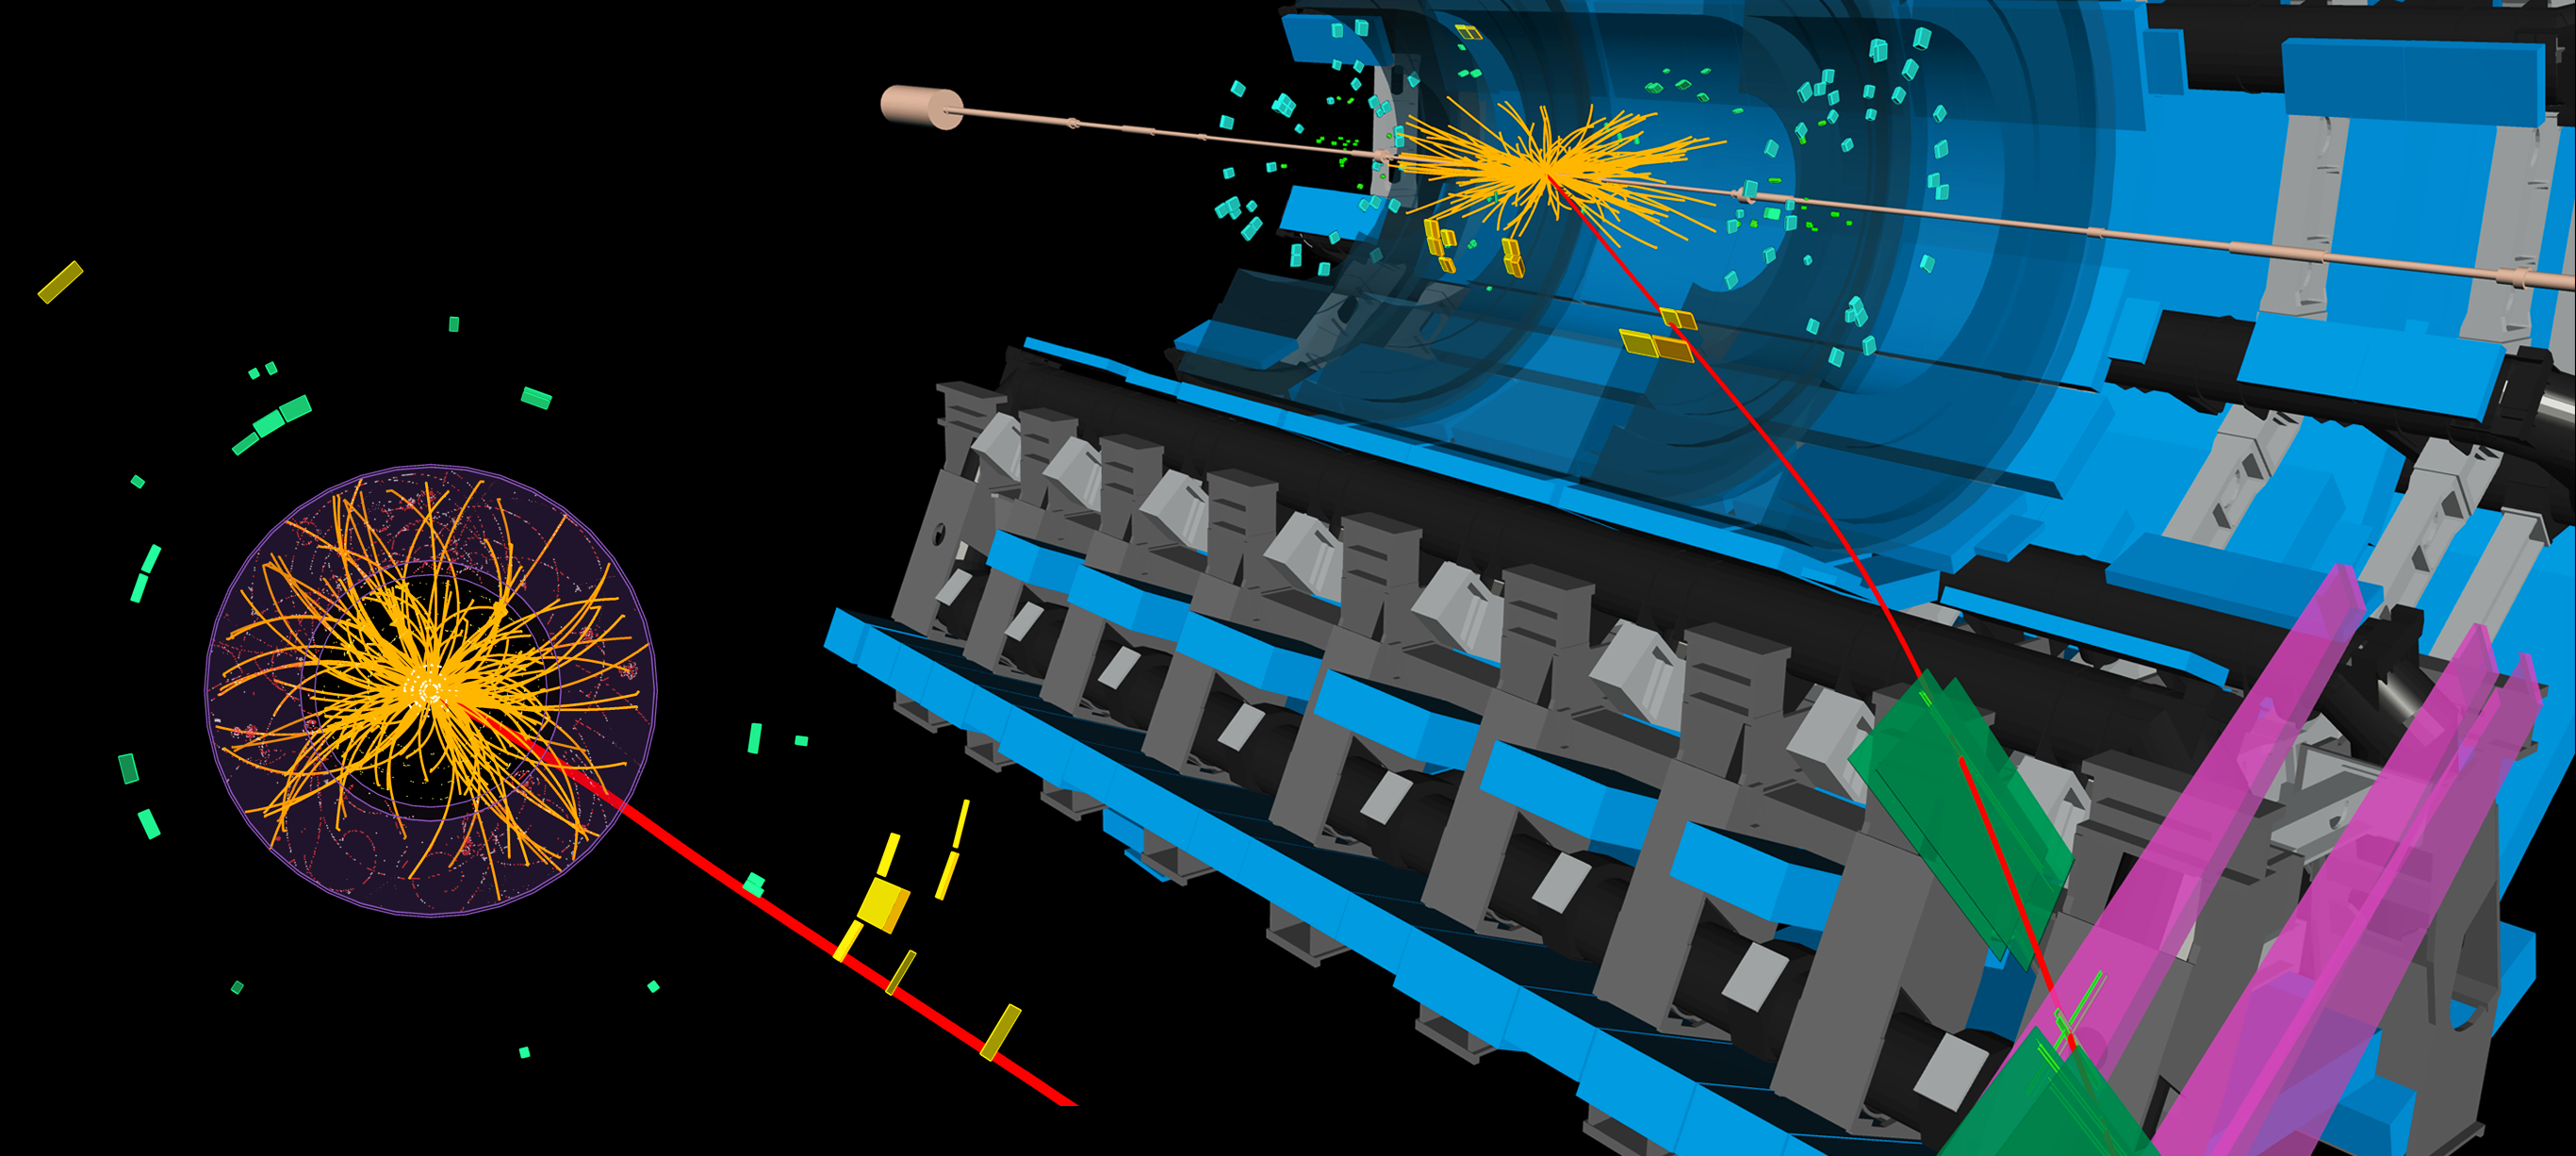
Our experimental data are stored in a custom format, which gathers bits of related information under a common name in a common container. This is called a “collection”, and we have “collections” of energy deposits, particle tracks, particle energies and so forth. Thus, I started accessing different collections in the data files, as shown in the above picture, to see if everything was in order with the newest release of our software and with its interaction with the experiment’s software framework. Then I applied several selection criteria to the data, to cut the clutter and emphasize the interesting content. After that, I tried different visualization settings to build different possible interesting views for the upcoming data.
As soon as we receive the new data, we start working hard on it. Our task is to inspect the physics objects in the event (electrons, muons, photons, etc.) to visually verify that everything is correctly measured and reconstructed.
While I was testing all that, I received an e-mail from the Data Preparation coordinators: “Stable Beams!”.
After a few minutes, another e-mail came, with the path of a data file containing the first 100 events of collision data, and a list of about 10 events that Data Prep experts flagged as “potentially interesting”.
There were two Data Visualization teams on duty: me, using the VP1 3D event display, which can access and visualize all kinds of ATLAS data; and a couple of people using Atlantis, a fast 2D application, mostly used to visualize final filtered data. As soon as we received the new data, we started working hard on it. Our task is to inspect the physics objects in the event (electrons, muons, photons, etc.) to visually verify that everything is correctly measured and reconstructed, and that the event is meaningful. Sometimes, we have to quickly prepare appealing images for the press releases that CERN publishes; in this case, we needed images for an update that afternoon.
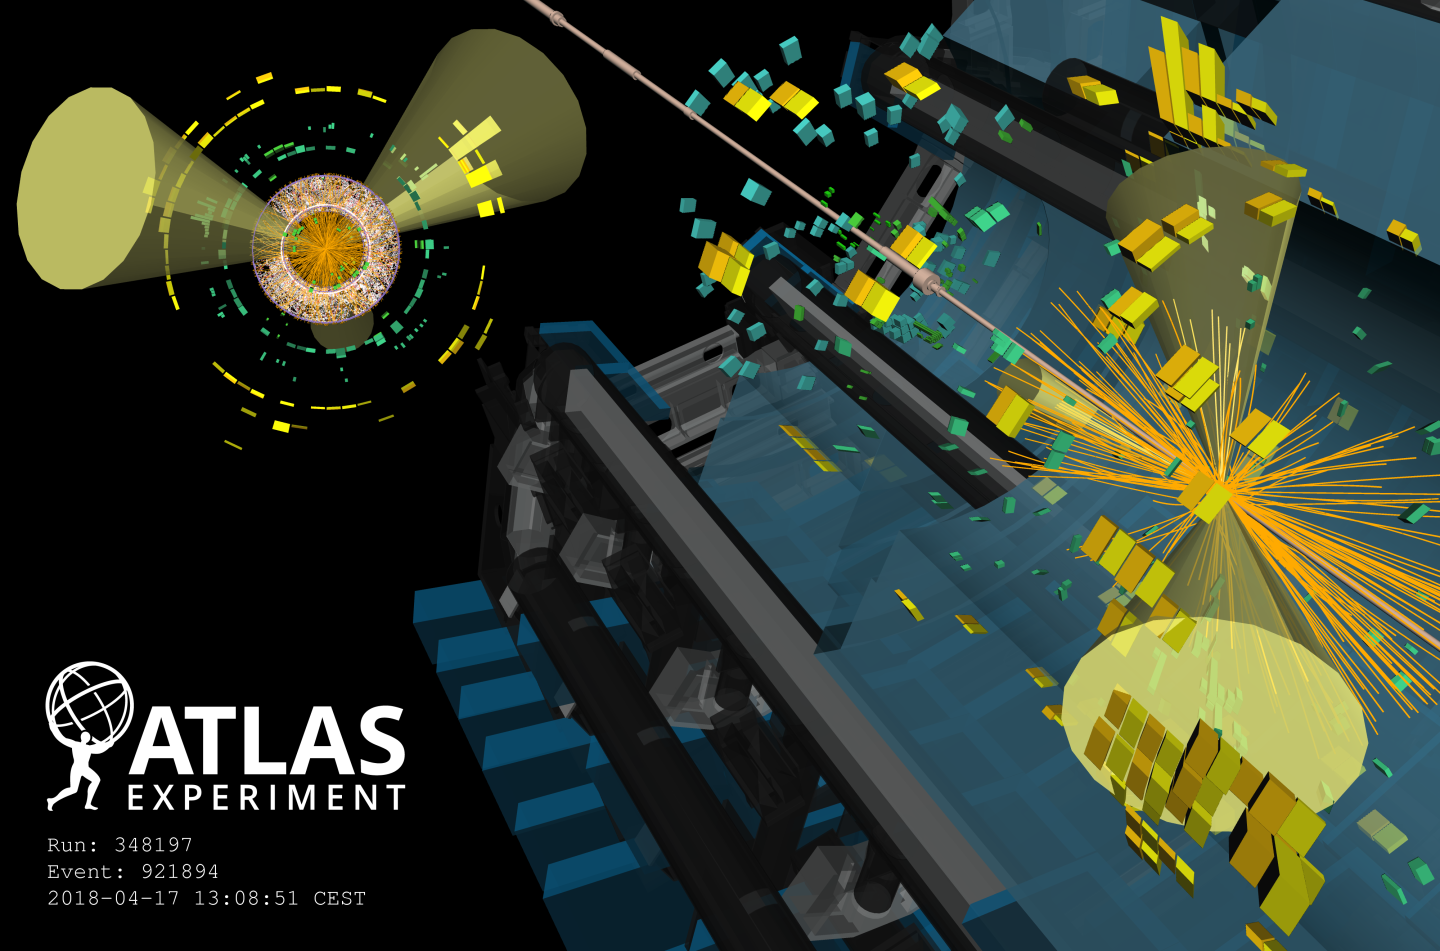
Over the course of an hour, e-mails carrying nice images of interesting events and technical comments were sent back and forth between experts at the ATLAS control room, Building 40, and institutes and universities around the world. One of those interesting events is shown here below, featuring three particle-jets (the yellow cones), which lets us verify that both the detectors used to measure the energy deposits in the calorimeters, and the algorithms used to manage and interpret their data worked correctly. At the end of a fast-paced selection process, we had two interesting events, verified and visualized, which were ready to be approved.

Everything released publicly must be approved by the ATLAS Management. Usually, especially for results concerning observations of physics phenomena or precise measurements, the approval takes a lot of time, involving a long process of several steps, where many experts check different aspects and the physicists who are part of the ATLAS collaboration can comment and ask for clarifications. But for event displays, especially those used for public communication, we have a fast-track approval process.
After creating the images, we sent them to the ATLAS Deputy Spokesperson and some relevant experts. After some e-mail exchanges and checks of the measured data, to verify the correctness of the physics objects we were showing, the Deputy Spokesperson signed off and the ATLAS Collaboration released the first images of this year’s data.
The data harvest begins
Earlier this week, the ATLAS experiment started recording data that is “good for physics”. It is the start of a feverish period for the accelerator and the experiments, full of the expectations and the hopes of thousands of physicists around the world. We are all eager to analyse the upcoming data, searching for answers to the many still-open questions in particle physics. This is just the start of an exciting new year!
About the author(s)
Riccardo Maria Bianchi
Riccardo Maria Bianchi is a particle physicist from the University of Pittsburgh, based at CERN where he works on the ATLAS Experiment. Over the past 12 years, he has worked on searches for supersymmetry and extra dimensions, muon detectors, data acquisition, parallel computing, computational methods, and interactive data visualization. He is the coordinator of the HSF “Visualization” working group, and of the ATLAS Virtual Reality group, and he recently collaborated on the textbook “Applied Computational Physics” (Oxford, 2017). He likes explaining science in simple words, collaborating with artists on works between art and science, and helping in the organization of public science exhibitions (Sperimentando 2018, Cultural Collisions). Follow Riccardo on Twitter or visit his website.