The Last Quark
23 July 2021 | By
One of the most successful paradigms in physics is to try to understand complex phenomena in terms of simpler building blocks. In the 19th century, Russian chemist Dimitri Mendeleev noticed that the properties of approximately 100 known chemical elements showed distinct patterns when arranged in a table according to their mass. With subsequent discoveries and insights from Antoine Becquerel, J.J. Thomson, Ernest Rutherford, Marie and Pierre Curie, James Chadwick and others, the modern ‘periodic table’ we know from school chemistry was born.
The disparate chemical elements are all made of the same building blocks: a compact ‘nucleus’ made of similar numbers of protons and neutrons, surrounded by a cloud of orbiting electrons. Each chemical element has a characteristic number of electrons, equal to the number of protons in its nucleus. The number and allowed arrangements of the electrons (governed by the laws of quantum mechanics) determine all the element’s chemical properties; whether it is stable or reactive, acid or alkaline, metal or non-metal etc. The rich structure of the periodic table can be explained by fundamental building blocks of electrons, protons and neutrons, and the ways in which they interact and fit together.
After the Second World War, increasingly powerful particle accelerators allowed protons or electrons to be boosted to high energies and smashed into dense material targets or, later, into other accelerated particles in head-on collisions. The debris from such collisions consisted not only of familiar protons, neutrons and electrons, but an ever-expanding ‘zoo’ of heavier and more exotic particles (collectively called ‘hadrons’) that would appear fleetingly and then rapidly decay into lighter, more familiar particles. As in Mendeleev’s periodic table, these particles could be arranged by their properties into intriguing patterns, which had their roots in a branch of mathematics called ‘group theory’.
In the 1960s, physicists proposed that hadrons were actually made up of combinations of two or three fundamental constituents, which they called ‘quarks’.

In the 1960s, physicists Murray Gell-Mann and George Zweig proposed that most of these particles were actually made up of combinations of two or three fundamental constituents, which they called ‘quarks’ (pronounced to rhyme either with ‘Mark’ or ‘York’). Most hadrons could be explained as combinations of just two quarks, dubbed ‘up’ and ‘down’, while a class of so-called ‘strange’ hadrons with anomalously long lifetimes could fit into the model by postulating a third ‘strange’ quark. Soon a fourth ’charm’ quark was proposed, providing an elegant solution to some problems in the description of weak interactions (the theory that underlies radioactive decay).
In parallel, experimentalists at the Stanford Linear Accelerator Center in California, USA, were colliding high-energy accelerated electrons with stationary protons, and measuring the angles at which the electrons came out from the collision. These showed that the proton was not a featureless solid object, but instead acted as if it contained three hard point-like constituents, exactly as would be expected in the quark model. Subsequent experiments have confirmed this picture: the proton is made of two up quarks and one down quark, the neutron is made of two down quarks and one up quark, and the other hadrons are all made of other combinations of quarks (and their antimatter partners, antiquarks). In the last few years, physicists have also found evidence for hadrons containing four or even five quarks.
But could there be more quarks? A fifth, dubbed the ‘bottom’ or ‘beauty’ (b) quark, was inferred in 1977 after the discovery of a new heavy hadron in proton–nucleus collisions at the Fermi National Accelerator Laboratory (Fermilab) near Chicago, USA. The quark model requires that quarks come in pairs, resulting in three ‘generations’ each with two quarks: up and down; strange and charm; and, finally, bottom and top – the sixth quark to complete the pair. Intriguingly, by this time the electron was also known to have two heavier cousins – the muon and tau – which, together with neutrinos, form three generations of leptons, another family of particles. The motivation for a sixth quark appeared compelling. But where might this quark be found?
Hunting the top quark
One of the fundamental characteristics of a particle is its mass, which determines not only how heavy it is (its weight under gravity), but how hard it is to accelerate. For example, a car is much harder to push by hand than a bicycle. Einstein’s famous equation E=mc2 tells us that mass, m, and energy, E, are proportional (related by the speed of light, c, squared). This means that a heavy particle requires much more energy to create than a light one. Particle physicists use this relationship to measure particle masses in terms of ‘electron volts’, where 1 electron volt is the energy acquired by an electron when it is accelerated by an electric field of 1 volt. This is an extremely small unit, and the proton has a mass of about 1 giga electron volts, i.e. 1000 million electron volts or 1 GeV for short, equivalent to 1.8x10⁻²⁷ kg.
In these units, the up, down and strange quarks have masses of less than 0.1 GeV; the charm quark, 1.3 GeV; and the bottom quark, 4.2 GeV. So, it was natural to assume that the top quark fit this sequence – with a mass of perhaps 10 to 20 GeV. Surely, after the discovery of the bottom quark, the top quark would be ‘just around the corner’.
As each new and more powerful particle accelerator or collider began its work, physicists hoped it would have enough energy to discover the top quark. But no convincing hints were seen, and the first data from the CDF and D0 experiments at Fermilab’s Tevatron proton–antiproton collider in the early 1990s showed that if the top quark exists, its mass must be more than about 100 GeV. On the other side of the Atlantic Ocean, experimentalists at CERN’s Large Electron–Positron Collider (LEP) in Geneva, Switzerland, were probing the top quark indirectly through precise measurements of the decays of the Z boson (a fundamental particle connected to the electroweak interaction) into different types of quarks and antiquarks. Due to conservation of energy, the Z boson, with a mass of about 90 GeV, would not be heavy enough to decay into a top quark–antiquark pair if the top quark (and top antiquark) mass is greater than 45 GeV. Nevertheless, the relative proportions of Z boson decays into other types of quarks could be subtly influenced by even the possibility of decays into top quarks, and measurements at LEP suggested the top-quark mass should be somewhere between 150 and 200 GeV. But did it really exist?
As each new and more powerful particle accelerator or collider began its work, physicists hoped it would have enough energy to discover the top quark. But no convincing hints were seen.
In a particle collider, collisions between high-energy protons and antiprotons can be understood as collisions between two opposing ‘bags’ of quarks or antiquarks, the constituents of the (anti)protons. The total energy of the accelerated proton is shared among the three quarks, with a fraction also going to gluons, other particles in the proton that represent the force binding the three quarks together. Physicists expected that the most likely way to produce top quarks in Tevatron’s 1.8 TeV (1800 GeV) collisions was through a head-on collision of a quark from the proton and an antiquark from the antiproton, producing a top quark and corresponding top antiquark (a 'top-pair'). Again, due to conservation of energy, this process would require the initial quark and antiquark to have at least twice the energy equivalent of the top-quark mass – that’s more than their fair share of their parent proton’s energy. This is rather unlikely, making top-pair production a rare process that becomes even rarer if the top quark is very heavy.
In the early 1990s, the CDF and D0 experiments began to accumulate evidence for the production of top–antitop pairs in their data sample. They finally announced their joint discovery of the top quark in 1995, measuring its mass to be about 180 GeV. This was around 10 times larger than the original expectation, but in agreement with the indications from LEP. Over the next 16 years, tens of thousands of top-quark events were recorded and studied by the two experiments, allowing physicists to build a first portrait of this new particle. As far as they could see, it behaved just as a partner of the bottom quark would be expected to – but why was it so heavy?
Top quarks come to Europe
When CERN’s Large Hadron Collider (LHC) turned on at its initial 7 TeV collision energy in spring 2010, catching a first glimpse of the top quark was high on many ATLAS physicists’ wish lists. Due to the much larger collision energy, the production of top–antitop pairs at the LHC is dominated by the collision of gluons from the two colliding protons, with a rate much higher than at the Tevatron.
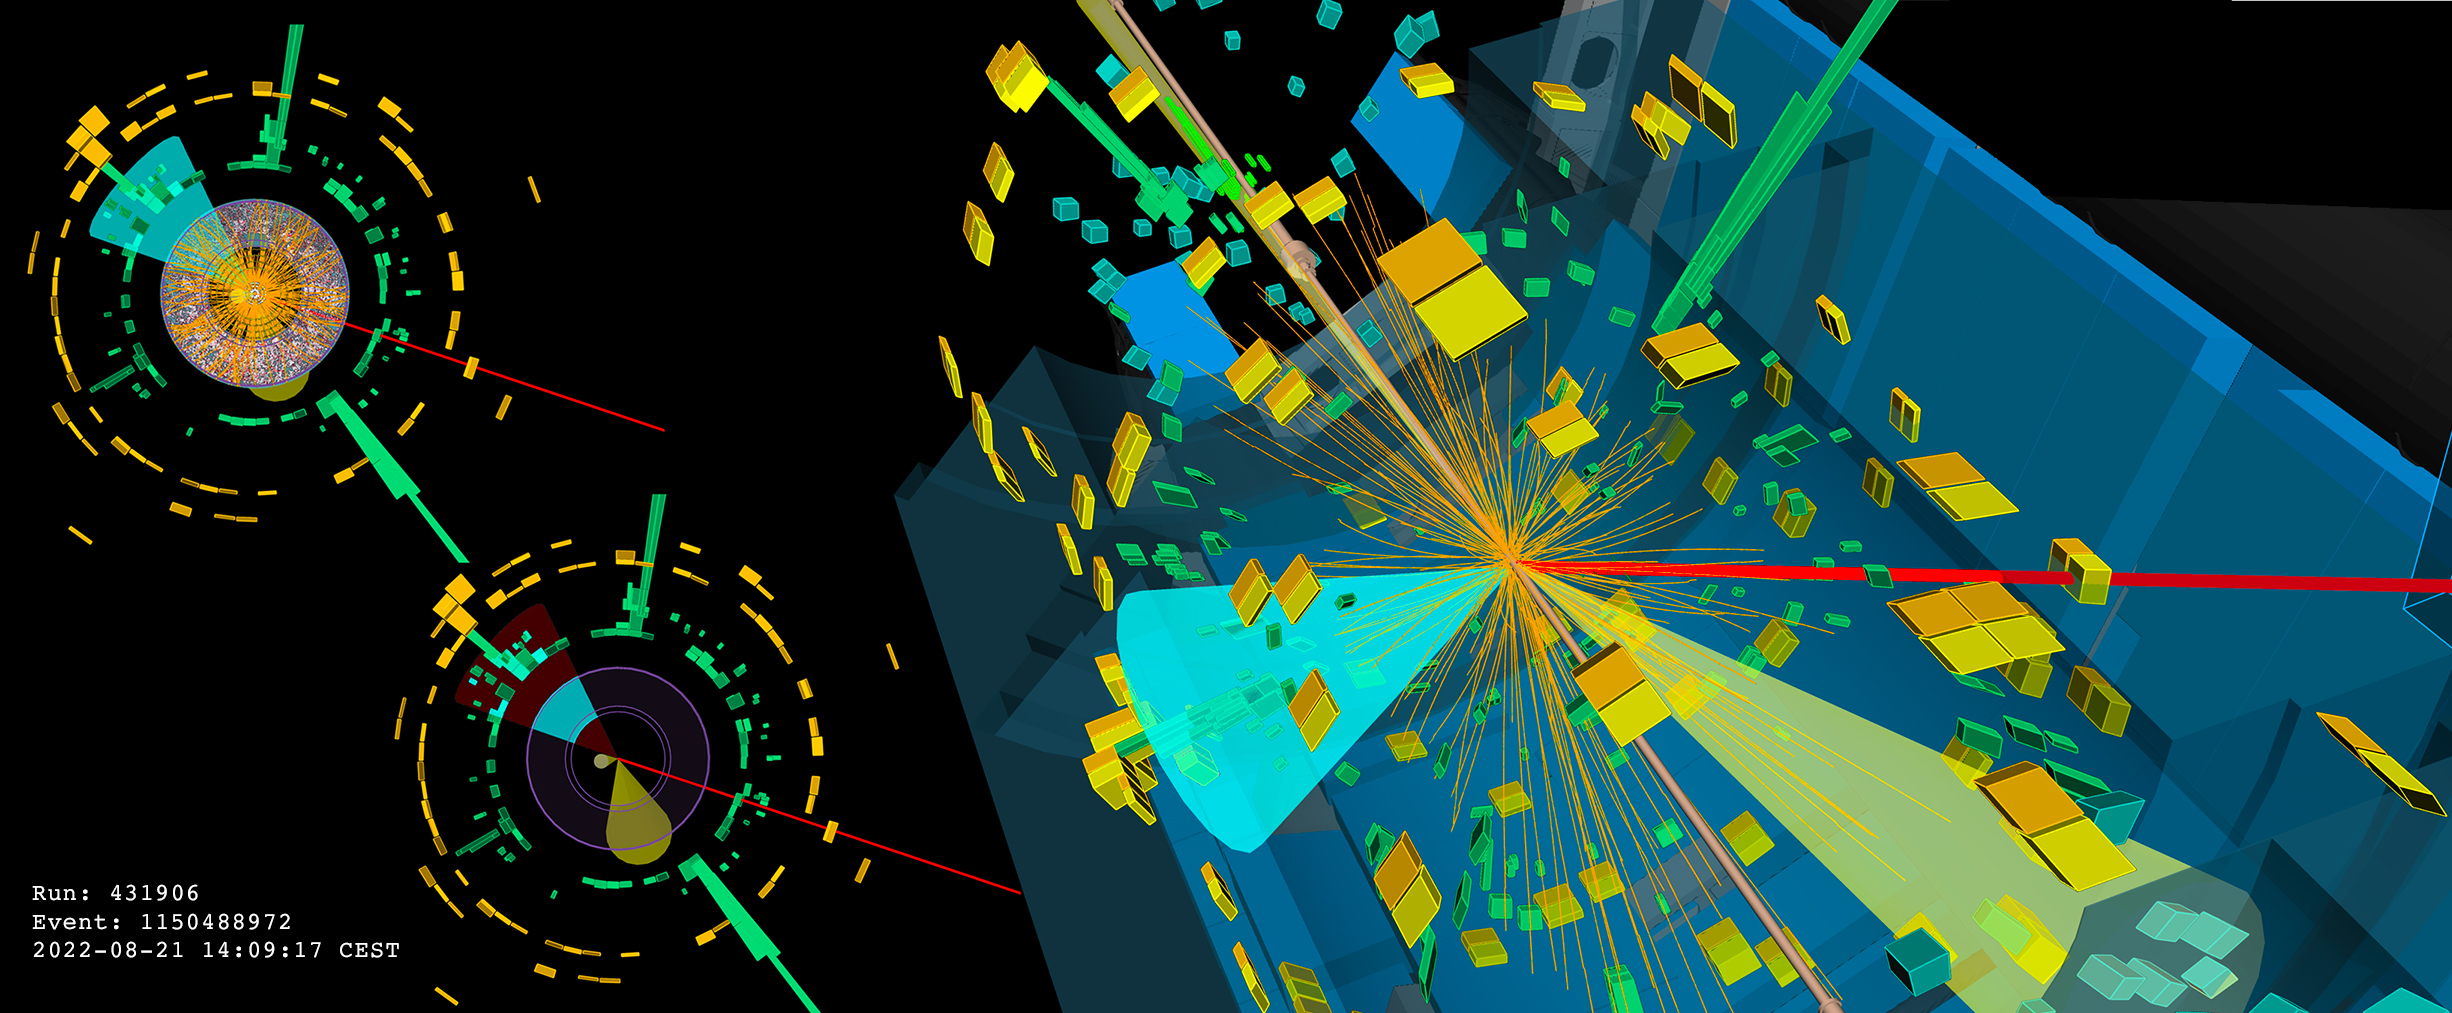
The top quark is not a stable particle. Rather than teaming up with other quarks to form hadrons, a process that takes several 10-24 seconds, it decays within 10-25 seconds to a W boson and a bottom quark. The W boson in turn decays into a quark–antiquark pair (usually up–down or charm–strange), and these quarks give rise to collimated sprays, or ‘jets’, of particles all heading roughly in the same direction in the detector. Alternatively, the W boson may decay to a lepton (e.g. an electron or muon) plus a neutrino. The neutrino passes through the ATLAS detector and escapes undetected, leaving an energy imbalance in the collision event once all the detected particles are accounted for. The b-quark also produces a particle jet, but one containing a hadron made up of a b-quark and a lighter antiquark, which travels a few millimetres in the detector before decaying. The charged particle tracks from this decay can be precisely reconstructed in ATLAS, and distinguished from other particles coming from the collision point. This allows the jet to be ‘b-tagged’ as likely to have been produced by a b-quark. With two top quarks producing two W bosons and two b-quark jets, the signature of top-pair production in the ATLAS detector is spectacular. It also provides an excellent ‘work out’ for the detector, and the processing, calibration and reconstruction of the recorded data.
The LHC accumulated data slowly at first, but by the summer of 2010 both the ATLAS and CMS collaborations were able to report the first observation of top-quark production in Europe. This milestone for the LHC programme set the stage for the discovery of the even more elusive Higgs boson just two short years later. One of the first top-pair events recorded in ATLAS, with the top quarks decaying to an electron, a muon, missing energy indicating neutrinos and a b-tagged jet, is shown in Figure 1.

The first observation of the top-quark at the LHC set the stage for the discovery of the even more elusive Higgs boson just two short years later.
As the LHC accumulated more data, and the collision energy was increased to 8 TeV in 2012 and 13 TeV in 2015, ever larger samples of top quarks were recorded by the ATLAS and CMS experiments, allowing it to be studied in greater detail. One of the primary measurements is that of the ‘cross section’, or rate at which top-quark pairs are produced for a given number of proton–proton collisions. Such measurements are conceptually simple: count the number of ‘top-like’ events seen in the detector; estimate and subtract off the number of events expected from other, non-top particle production processes giving rise to similar event signatures; and then correct for the estimated fraction of top-pair events that were missed.
In reality, years of painstaking work are required to understand the data and corrections well enough to make measurements with uncertainties of just a few percent. Calculating how many events we expect is also a formidable challenge, requiring knowledge of the exact mixture of quarks and gluons inside the proton (derived from many previous experiments), and the probabilities that quarks and gluons of particular energies will actually interact and produce a top–antitop pair. The result of this effort is shown in Figure 2: across the full range of proton–proton collision energies (denoted by √s) studied so far, top-antitop quark pairs are produced exactly as often as the theory says they should be, within uncertainties of a few percent. So far, this mysterious particle behaves just as expected for a very heavy partner of the b-quark.

Weighing the top quark
The usual way to determine the mass of an unstable particle is to measure the energies and directions of the particles it decays into. As energy is conserved in the decay, the energy locked up in the mass of the particle reappears in the mass of the decay products. Any excess energy is converted into the motion of the decay products (i.e. their kinetic energy) as they fly apart from the initial decay point. This works well, for example, for the decay of a Z boson into two electrons or muons, whose energies and directions can be measured precisely in the ATLAS detector. The more Z-boson decays we record and analyse, the more precisely we can determine its mass.
However, the top quark decays into a W boson and a b-quark, neither of which is a stable particle. The b-quark produces a collimated jet of particles and, if the W boson decays into a quark–antiquark pair, two more such jets are produced. By measuring the energy and direction of these sprays of particles in the detector, the energy and direction of each of the original quarks can be inferred. By doing this for the quark and antiquark from the W boson, and for the original b-quark from the top decay, the mass of the top quark can be calculated.
But if the W boson decays to a lepton (e.g. an electron or muon) and a neutrino, things are a little more complicated. The lepton can be precisely measured, but the neutrino escapes the ATLAS detector without leaving any trace, so its energy and direction can only be guessed at from an ‘imbalance’ in the rest of the event. As there are two decaying top quarks in each event, it is also necessary to decide which particle jets and leptons belong to which top-quark decay – get this wrong, and a wrong value for the top mass, often far from the true value, is obtained.
The results of applying this technique to about 40,000 top-pair events recorded by ATLAS in 2012 are shown in Figure 3 (left). The peak of the distribution is around 160 GeV, but it is rather broad, with many events showing a top-quark mass below 150 GeV or above 170 GeV. This is mainly because the measurement of jets is an imprecise process – a quark with a true energy of 50 GeV may give rise to a jet that is incorrectly measured to have an energy of 40 or 60 GeV. But these effects average out over many events. The right plot in Figure 3 illustrates the reconstructed mass of the quarks assumed to come from the W-boson decay in each event; here the peak is close to 80 GeV and, since the W-boson mass is known from other measurements to be precisely 80.4 GeV, this provides an important ‘calibration’ measurement in the data analysis that helps reduce the uncertainty due to the jet measurement.
The final result from this analysis gives a top-quark mass value of 172.1 ± 0.9 GeV. This is about 12 GeV higher than the apparent peak position in Figure 3 (left), showing the importance of all the effects that distort the shape of the mass distribution, such as the imperfect jet resolution and the mis-assignment of jets to the wrong top-quark or W-boson decays. Physicists rely on theoretical models and computer simulations to predict these effects, and these models are limited by our lack of understanding of what actually happens when top quarks decay.


Most quarks exist confined within hadrons, either in twos or threes. The force that keeps them bound together is the strong nuclear force, which has some similarities with the electromagnetic force that acts on charged particles (opposite electric charges attract, like charges repel). The analogous charge of the strong nuclear force is called ‘colour’, and comes in not one but three varieties: red, green and blue (although this has nothing to do with the everyday meaning of ‘colour’). Hadrons must be ‘colourless’, meaning that the colour charges of their constituent quarks must balance, e.g. red + anti-red, or red, green and blue.
When a high-energy quark (say a red one) transforms into a jet of colourless hadrons (with no overall colour), the original red must be ‘neutralised’ by another coloured quark or quarks elsewhere in the event. This ‘colour exchange’ process, which also implies exchange of momentum and energy, is not well understood theoretically and has implications for top-quark decays. Does the top quark exchange colour with other quarks in the event before it decays? Does it pass its colour to the b-quark produced in its decay, and where does that ‘excess’ colour go? After all this shuffling of colour, what happens to the reconstructed top-quark mass in the ATLAS detector? Estimates range from a negligible change, to shifts of about 1 GeV – larger than the precision with which we can now measure the mass experimentally.
One way to explore these questions is to measure the top-quark mass in other ways – ways that are less reliant on an analysis of the decay products, and easier to relate theoretically to a ‘clean’ definition of the quark’s mass. For example, the prediction of the top-pair production cross-section shown in Figure 2 depends on the top-quark mass – the heavier it is, the less frequently it is produced. Changing the top-quark mass assumed in the prediction by more than about 2 GeV would destroy the agreement between prediction and measurement.
The momentum distributions of the top quarks produced at the LHC, or the leptons in their decays, also depend on the mass. Several such indirect measurements exist, and they typically agree with the average of 172.7±0.5 GeV obtained from all the ATLAS measurements made so far using the top quark decay products. However, the uncertainties on the indirect measurements performed so far are at the level of 1 to 2 GeV, too large to clearly see possible effects of 1 GeV or less that might be present in the decay-product-based measurements.
Why does this matter? Since the discovery of the Higgs boson at the LHC in 2012 and subsequent precise measurements of its mass, powerful new ‘consistency tests’ of the theoretical underpinnings of particle physics (the Standard Model) became possible. In particular, the precise measurements of the top-quark and Higgs-boson masses can shed light on particle interactions at extremely high energy scales, far beyond what we can ever hope to probe with particle accelerators on Earth. If the top quark is too heavy relative to the Higgs boson, the Standard Model breaks down – it would even suggest that the entire Universe is in an unstable state, making it implausible that it has survived the 14 billion years since the Big Bang. Based on the current measurements of the top-quark mass, the Universe might be considered on a ‘knife edge’, balanced between stability and instability.
But since we are all still here, a heavy top quark probably implies that the Standard Model is incomplete – we have not yet understood all there is to learn about fundamental particles and their interactions. If the top quark is slightly lighter, perhaps the Standard Model is enough, though the question remains why we are so close to the edge. A more precise, and better understood, top-quark mass measurement could tell us whether we really are in this intriguing situation.
Tops with everything
Is the top quark special, or is it ‘just another quark’? Its enormous mass of around 173 GeV compared to the other quarks (all less than 5 GeV) also puts it above the masses of the electroweak W and Z bosons (80.4 GeV and 91.2 GeV, respectively), and the Higgs boson (125 GeV). If the top quark is just a quark, the Standard Model precisely predicts how it should interact with these bosons. If the top quark is something else – perhaps more closely connected to the electroweak or Higgs bosons – it may interact with them differently. The main signature of these interactions is the production of events with a top-pair and Higgs or Z boson, making for spectacular and complex signatures in the detector. The cross section of such events, as well as characteristics such as the momentum distribution of the produced bosons, depends on the details of the top–boson interaction (its ‘coupling’).
Using the large data sample collected during Run 2 of the LHC from 2015 to 2018, ATLAS has begun to make measurements of these processes. Since the W bosons from the top quarks can decay in a variety of ways (into quark–antiquark pairs, electrons, muons or taus), and the Z and Higgs (H) bosons can also decay in many different ways, there are a plethora of experimental signatures of such events. These typically feature two, three or four electrons or muons, and several jets from e.g. the b-quarks in the top decays. However, the production rate of top-pair + Z/H events is small, and other types of events can give rise to similar signatures. For example, top-pair + W events with the W boson decaying to an electron or muon, or events where some other particle is mistakenly identified as an electron or muon.

Figure 4 shows one search for top-pair + Higgs production, analysing decays of Higgs bosons and top quarks to leptons. The results are expressed in terms of a ‘signal strength’ represented by μ, which is the ratio between the measured production rate and that expected in the Standard Model. A value of one indicates exact agreement between the measurement and the Standard Model prediction, whereas zero indicates no such events were seen. For this analysis, the final μ value averaged over all the explored decay signatures is μ=0.58 +0.36 -0.33. This is a ‘glass half full’ value – compatible with both top-pair + Higgs production at the Standard Model rate, or none at all. As a by-product, this analysis also measured the rate for top-pair + W production and found results about 40% higher than expected, consistent with earlier dedicated measurements on a smaller fraction of the ATLAS Run 2 dataset, and reflecting the difficulties in unambiguously separating events likely to come from top-pair + H and top-pair + W processes.
An alternative strategy is to exploit the rare but very striking decay of the Higgs boson to two photons (the massless boson of the electromagnetic interaction). In this analysis, events with two photons and additional particles consistent with the production of a top-pair were selected, and the mass distribution of the two photons was studied, as shown in Figure 5. The upper plot shows a bump where the mass of the two-photon system is close to 125 GeV, the mass of the Higgs boson. The contributions from other processes giving rise to the same final state should not have any such bump, and can be modelled with a smooth curve. After subtracting these background processes (lower plot), the contribution from top-pair + Higgs production is clear, albeit from just a few handfuls of events. The signal strength from this analysis is μ=0.92 + 0.27 -0.24, compatible with the Standard Model expectation of unity, and strongly suggesting the top quark and Higgs boson do indeed interact with about the expected strength.

The production of top-pair + Z events is somewhat easier to observe, thanks to the distinctive decay of the Z boson to two electrons or two muons, which can be efficiently reconstructed with very little possibility of confusion with other processes. With the full Run 2 dataset, ATLAS physicists have isolated enough top-pair + Z events to not only measure the rate, but to study the momentum distribution of the Z bosons, as shown in Figure 6. The largest fraction of events have Z-boson momentum values (pTZ) around 100 GeV, and both the overall rate of events and the shape of the pTZ distribution are well-reproduced by the theoretical predictions.
So, at least for top-pair + Z events, the Standard Model appears to be winning. But more data from Run 3 of the LHC, due to start in 2022, will be needed to complete the picture, especially for the top-pair + Higgs and top-pair + W boson processes.
As far as we can see, the top quark looks like a quark, it swims like a quark, and quacks like a quark. And yet – it does not fit the pattern.
While waiting for more data, physicists are also working to tease as much information as possible from the measurements that we have. The Standard Model provides one clear set of predictions as to how top quarks, and W, Z and Higgs bosons should behave at high energy – but there are lots of alternatives involving the effects from additional hypothesised particles or interactions. Rather than testing them all, an elegant mathematical approach is provided by Effective Field Theory. This technique considers all possible modifications to e.g. the couplings between the top quark and the bosons that are consistent with basic physical principles. The new couplings are made to vary in such a way that they have no effect at low energies (where the theory is equivalent to the Standard Model), but become important at higher energies, where deviations from the Standard Model predictions might be expected.

The effects of each of these modifications can be calculated generically, without knowing the details of the new particles or interactions that might give rise to them, providing a library of deviations that can be compared to current measurements. Effective Field Theory also provides a way to treat data from different particle interactions (e.g. WW-scattering as discussed here) in a consistent way, allowing a 360° view of our current understanding of particle physics at the highest energies. Physicists are now applying these techniques to data involving top quarks, and the results should become even more interesting as the data become more precise in LHC Run 3.
The rarest process involving top quarks studied at the LHC so far is the simultaneous production of two top quarks and two top antiquarks, referred to as ‘four top production’. This is expected to be around 70,000 times rarer than top-pair production, yet ATLAS and CMS have recently seen first hints of such events using their full Run 2 dataset. The ATLAS analysis gives μ=2.0 +0.8 -0.6; this is about twice the expected rate, but still compatible with the Standard Model prediction within uncertainties. Many theories proposing new particles or interactions beyond the Standard Model could give rise to such an enhancement. This just maybe a first tantalising hint of excitement to come, but Run 3 data will be needed to know for sure.
Twenty-five years after the discovery of the top quark, we now know a great deal about this super-heavy fundamental particle. As far as we can see, it looks like a quark, it swims like a quark, and quacks like a quark. And yet – it does not fit the pattern. It is so much heavier than all the other quarks, and seems to sit more easily among the heavy bosons of the electroweak sector of the particle zoo. Is this a coincidence? Trying to understand patterns has been a powerful technique in our exploration of Nature thus far, and has brought us the periodic table, our understanding of hadrons, and much more. But when something does not fit the pattern, this is often a hint that something new is lurking around the corner. We have not found it yet – but we will keep looking!
About the author
Richard Hawkings did his PhD in Oxford, UK, and has worked as a CERN fellow and DESY fellow before becoming a staff research physicist at CERN. He has been a member of the OPAL collaboration at LEP and the ATLAS collaboration at LHC, where his work focuses on precision Standard Model physics, particularly involving top quarks. He has held various coordination roles on ATLAS including physics coordinator and top working group convener. He now co-leads the ATLAS luminosity measurement group.
Further reading
- Measuring top production at the LHC, ATLAS Physics Briefing, July 2014
- Studying fragments of the top quark, ATLAS Physics Briefing, October 2017
- Unraveling Nature’s secrets: vector boson scattering at the LHC, ATLAS Feature
Scientific papers
- Measurement of the ttbar cross-section and lepton differential distributions in e𝜇 dilepton events from pp collisions at √s=13 TeV with the ATLAS detector (Eur. Phys. J. C 80 (2020) 528)
- Measurement of the top quark mass in the tt→ lepton+jets channel from √s=8 TeV ATLAS data and combination with previous results (Eur. Phys. J. C79 (2019) 290)
- Analysis of ttH and ttW production in multilepton final states with the ATLAS detector (ATLAS-CONF-2019-045)
- Measurement of the properties of Higgs boson production at √s=13 TeV in the H→𝛾𝛾 channel using 139 fb-1 of pp collision data with the ATLAS experiment (ATLAS-CONF-2020-026)
- Measurement of the inclusive and differential production cross sections of a top-quark-antiquark pair in association with a Z boson at √s=13 TeV with the ATLAS detector (arXiv: 2103.12603, see figures)
- Measurement of the tttt production cross-section in pp collisions at √s=13 TeV with the ATLAS detector (arXiv: 2106.11683, see figures)